Economics & markets
Implications of rising bond yields
September 23, 2026
- Commentary
- Market views
- Regional outlooks
Implications of rising bond yields
Commentary by Roger Aliaga-Díaz, Vanguard Global Head of Portfolio Construction and Chief Economist, Americas, and Roger Hallam, Vanguard Global Head of Rates
On our “Market views” tab: Earnings carry the weight as rates are the watch item
Global bond yields have risen steadily in 2026, with the key drivers including high energy prices, stubborn above-target core inflation, hawkish central banks, growing concerns about governments’ fiscal sustainability, and increased demand for capital amid the AI buildout.
In the following Q&A, Roger Aliaga-Díaz and Roger Hallam unpack the increase in rates while touching on the Federal Reserve, how AI equity valuations could fall back to Earth, and portfolio implications.
What has driven the rise in bond yields this year?
Hallam: There have been four key drivers. First, inflation has returned to the forefront of investor concerns. The conflict in the Middle East has resulted in a sharp increase in energy prices, raising headline inflation pressures. Core inflation has also proved more stubborn at above-target levels than central banks had forecast, raising concerns surrounding their credibility on inflation.
Second, despite the drag on real incomes from higher prices, growth has generally proved resilient, with the AI buildout a significant driver of growth in the U.S. and with Europe benefiting from fiscal tailwinds.
Third, the sustained above-target inflation and resilient growth have seen central banks turn more hawkish, with the Fed, the European Central Bank, and the Bank of Japan having increased interest rates.
And finally, we’re seeing an increase in competition for capital. Sovereign debt issuers continue to run sizable deficits and issue large amounts of government bonds. On top of this, corporate bond issuance has also increased significantly this year to fund the enormous AI-related capital expenditure need. This combination of elevated sovereign and corporate bond issuance is putting upward pressure on term premium.
How do you think about the Fed’s approach under a new chairman?
Aliaga-Díaz: Given these strong and persistent forces in the economy, the Fed is at a key juncture and its response in terms of potential rate hikes over the next few months will be critical. In that context, the new chairman’s communication framework—where the Fed is signaling less about how policy will unfold—means we’re kind of changing horses in the middle of the stream. The markets may need some convincing that less communication doesn’t have to signal less credible monetary policy.
During the global financial crisis, forward guidance about policy moves was a useful tool for easing financial conditions. But it’s not a monetary policy pillar. Before that time, monetary policy pillars were independence, credibility, and rules-based decision-making. The market doesn’t need to have the rules communicated. The market learns what the rules are through repeated actions.
Hallam: The coming months will be telling. If growth signals remain upbeat and inflation data doesn’t suggest that the Fed is making material progress toward its 2% inflation goal, the federal funds rate will likely have to go higher. Through that process, we’ll get a clearer picture of the Fed’s reaction function to inflation and how it thinks about the growth-versus-inflation trade-off. The Fed’s task forces should also provide greater clarity on its views related to the AI buildout and the near-term inflation pressure that’s generating versus the potential longer-term productivity benefits.
It will also be interesting to see how the Fed’s thinking around the neutral rate evolves following the chairman’s comment at Jackson Hole last month that he’d be “hard-pressed to describe broad financial conditions as restrictive.” I do think the significant investment we’re observing in AI-related sectors will raise the potential growth rate of the economy in the future, which will support faster rates of GDP growth without generating inflationary pressures. Near term, though, there is uncertainty about whether that positive supply impulse arrives before inflation levels become unacceptable.
How long can AI drive market returns and economic growth?
Aliaga-Díaz: We’re in the investment phase of AI, where the buildup of AI infrastructure is driving strong economic growth. This will be followed by a second phase of higher productivity growth unlocked by the diffusion of AI technology throughout the economy. In terms of the markets, there has been a lot of talk about equity overvaluation. The question now is whether there are any fundamental drivers that can sustain those valuations or whether we have an irrationally overvalued stock market. The more we look at the data, we essentially see that increasing earnings expectations can continue to sustain these valuations.
But while the equity market seems to be priced for the more optimistic scenario, more pessimistic outcomes such as overinvestment or disappointment in the actual use of the technology can’t be ignored. The level of earnings growth could slow. Another risk is if the 10-year Treasury yield settles meaningfully above 5%. That would translate into a higher discount rate, meaning anticipated future cash flows would be worth less today, which typically lowers equity valuations.
Hallam: An important question is, will the current pace of earnings growth be sustained? Price/earnings multiples on the Standard & Poor’s 500 Index are elevated but not extreme. What has been more extreme is the pace of earnings growth. If high earnings growth can be sustained, AI-related sectors still have substantial upside.
If earnings growth were to slow notably, that would be a setback for AI-related sectors. However, for the broader economy, it would be important to understand why earnings growth is slowing. If it’s because the real economy is not finding productive ways to utilize AI technology, that would clearly be an overall negative. Personally, I think that’s unlikely. More realistically, earnings growth could slow because the price of AI inference falls as capacity increases or because new technologies disrupt current models. That is to say, AI effectively gets democratized so everyone has access at a very low frictional cost. That would be a great outcome for the economy, although potentially less positive for exposed companies that have spent billions of dollars investing in the sector if they are unable to monetize that investment.
Switching to government debt, how do current government bond yields reflect fiscal sustainability concerns?
Hallam: As mentioned earlier, a rising term premium, driven partly by high levels of government bond issuance, has contributed to the rising bond yields we’ve seen year to date. It’s important to recognize this is a global phenomenon, not just a U.S.-specific issue. For example, we also see high or rising deficits in other G7 nations such as the U.K., Japan, Germany, and France. Investors are concerned that fiscal sustainability, which has historically been viewed as a medium-term issue, should increasingly be viewed as a growing near-term risk.
From a markets perspective, I do think concerns around fiscal sustainability will be a persistent theme and I expect that to result in an incremental increase in term premium over time. Near term, though, government bond auctions remain well supported. And when you look at measures such as U.S. swap spreads, which are the difference between Treasury yields and comparable-maturity swap yields, they do not point to heightened near-term concerns around Treasury funding.
To wrap up, how do we think about portfolios? Is it a good time to be a fixed income investor?
Aliaga-Díaz: Given rising bond yields, some reports suggest that bonds haven’t had the same level of diversification benefits in recent years as they’ve historically enjoyed. These reports discuss how bonds’ correlation to stocks has frequently been positive in the last several years, meaning they’ve more often moved in the same direction as stocks. But correlation isn’t the only source of diversification for bonds. More importantly, bonds can help overall portfolio risk remain generally aligned with the risk profile of each investor. In today’s high-rate environment, even for more conservative portfolios—such as those for retirees or pre-retirement accumulators—bonds can also offer a potentially attractive source of return and income.
Hallam: Fixed income has posted meager returns year to date, as capital losses resulting from higher yields have offset coupon income. However, as we look forward, the outlook for fixed income investors has materially improved. Yes, inflation remains high and global central banks look set to moderately raise interest rates, but those actions are well priced into markets. Prevailing yield levels across U.S. and global aggregate bond indices are as high as we’ve seen in the past couple of decades. Investors buying fixed income today earn high levels of income, providing a substantial cushion against future yield increases.
It is also the case that if the economic outlook were to turn less favorable and growth were to weaken—an environment in which stocks tend to suffer and central banks cut interest rates—bond yields would likely fall and could decrease substantially if the slowdown was severe. In that environment, the diversification provided by fixed income exposure would act as solid ballast for investors’ portfolios.
So although 2026’s year-to-date fixed income returns are disappointing, I would argue that looking forward, the case for owning fixed income has become more compelling.
Earnings carry the weight as rates are the watch item
Market views by Kevin Khang, Vanguard Senior Global Economist, and Kevin Zhao, Vanguard Economist.
Despite busy headlines—including conflict in the Middle East, rising global yields, and AI safety risks—the main driver of the U.S. equity market remains earnings, increasingly shaped by the pace of AI capital investment and its prospects for monetization. The result is a market that appears calm on the surface but carries unease beneath it, reflecting uncertainty about the durability of those earnings and their concentration in a single theme: the AI complex, which represents roughly 40% of U.S. equity market capitalization from hyperscalers through the broader AI supply chain.
The tension shows up in two ways. First, the market’s earnings yield has gone up this year (and its valuation—the inverse of earnings yield—has gone down), even as earnings growth has accelerated to historic highs. This contrasts with prior years when prodigious earnings growth was rewarded by multiple expansion.
Earnings yield and 10-year Treasury yield moving in tandem
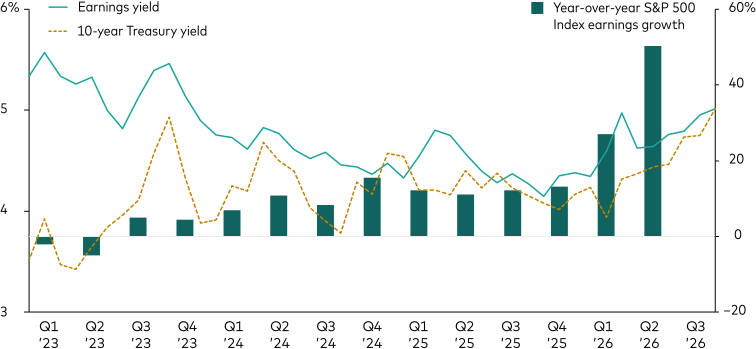
Notes: This chart compares the S&P 500 Index earnings yield and 10-year U.S. Treasury yield from the first quarter of 2023 to the third quarter of 2026, along with the S&P 500 Index year-over-year earnings growth from the first quarter of 2023 to the second quarter of 2026.
Sources: Vanguard calculations, based on data from Bloomberg, as of September 15, 2026..
Second, a great deal of repricing has been taking place under the placid index-level volatility, where return dispersion across individual stocks has climbed to levels normally associated with drawdown periods.
A benign effect of rising yields?
Against the backdrop of rising U.S. Treasury yields, the key question looking forward is what additional impact this might have on U.S. equities. If the rising yield is driven by an anticipated pickup in real economic growth, the yield increase could be benign—or even supportive—for equity valuation. But, as noted in this Q&A from Roger Aliaga-Díaz and Roger Hallam, another important factor may be contributing to the rise in yields. It’s likely that part of the increase reflects fiscal-sustainability concerns and uncertainty around a new approach from the Federal Reserve.
More time will be needed to understand whether the joint increases in earnings yield and Treasury yield over last few months are connected or entirely coincidental. But one thing is clear—if rates settle structurally higher, it would become another factor that eventually weighs on U.S. equities. For instance, rising funding costs could impact the pace and/or cost of AI capital expenditure investment and create headwinds for more debt-dependent small- and mid-cap companies.
For the next few quarters, what earnings and IPO filing documents tell the market about the emerging economics of AI and AI capex sustainability will likely remain the dominant driver of U.S. equities—but these rate channels, and whether they stay dormant or begin to bite, are worth monitoring closely.











Notes:
All investing is subject to risk, including possible loss of the money you invest.
Diversification does not ensure a profit or protect against a loss.
Bond funds are subject to the risk that an issuer will fail to make payments on time, and that bond prices will decline because of rising interest rates or negative perceptions of an issuer’s ability to make payments.
Investments in bonds are subject to interest rate, credit, and inflation risk.
Investments in stocks or bonds issued by non-U.S. companies are subject to risks including country/regional risk and currency risk. These risks are especially high in emerging markets.
Funds that concentrate on a relatively narrow market sector face the risk of higher share-price volatility.
Past performance is no guarantee of future results.
U.S. government backing of Treasury or agency securities applies only to the underlying securities and does not prevent share-price fluctuations. Unlike stocks and bonds, U.S. Treasury bills are guaranteed as to the timely payment of principal and interest.
The S&P 500 Index is a product of S&P Dow Jones Indices LLC, a division of S&P Global, or its affiliates (“SPDJI”) and has been licensed for use by Vanguard. Standard & Poor’s® and S&P® are registered trademarks of Standard & Poor’s Financial Services LLC, a division of S&P Global (“S&P”); Dow Jones® is a registered trademark of Dow Jones Trademark Holdings LLC (“Dow Jones”); and these trademarks have been licensed for use by SPDJI and sublicensed for certain purposes by Vanguard. Vanguard 500 Index Fund is not sponsored, endorsed, sold or promoted by SPDJI, Dow Jones, S&P, or their respective affiliates, and none of such parties make any representation regarding the advisability of investing in such product(s) nor do they have any liability for any errors, omissions, or interruptions of the S&P 500 Index.