Understanding bonds
Is the Agg enough for your fixed income portfolio?
June 30, 2025
Get more with Vanguard Core Bond ETFs
Some advisors believe that the Bloomberg U.S. Aggregate Index, or the Agg, is the definitive proxy for the U.S. taxable bond market, just as the Standard & Poor’s 500 Index serves as a proxy for U.S. stocks.
However, unlike the stock indexes, the Agg (and its sister index, the float-adjusted version) only offers partial exposure to the U.S. bond market. And remember that the U.S. bond market makes up less than 40% of the global fixed income market, which means that clients who track the Agg in their fixed income allocations miss out on a wider playing field that could enhance diversification and improve potential returns.
A simple solution: Active products that can invest beyond the Agg, like the Core-Plus Bond ETF (VPLS).
Vanguard Core Bond ETF (VCRB) can invest beyond the Agg, but with a more conservative mandate than Core-Plus products. Both VPLS and VCRB launched late in 2023.
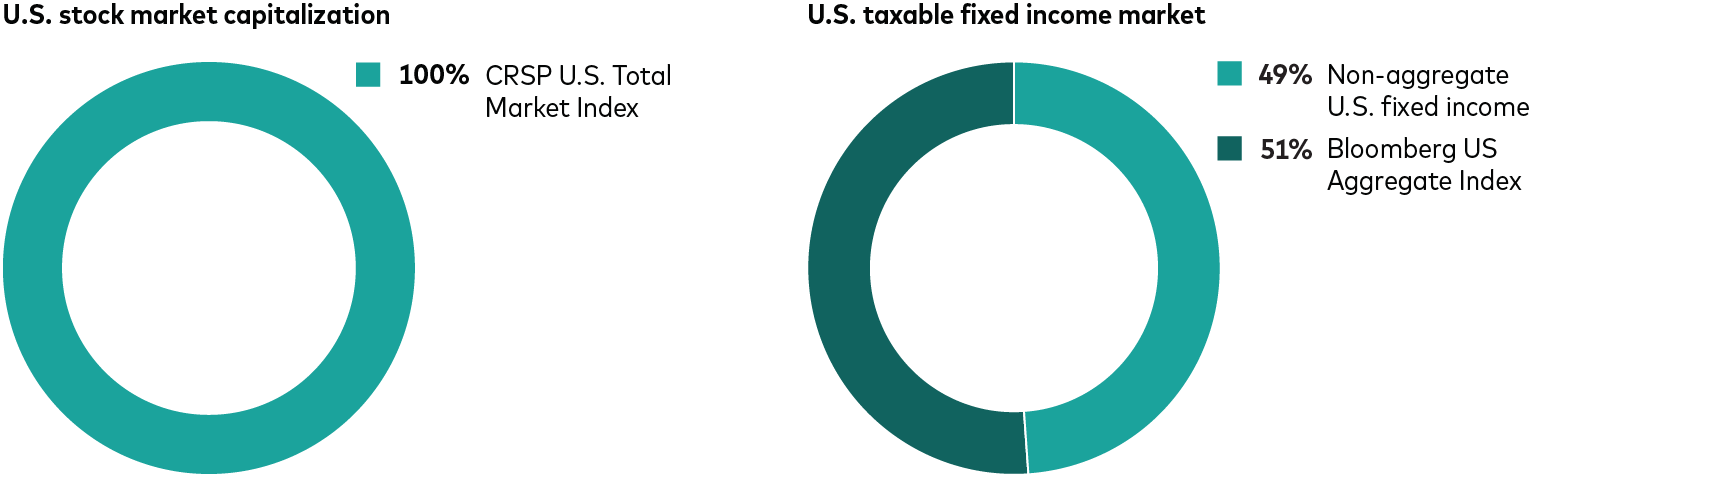
Source: Bloomberg, as of March 31, 2025.
What’s in and out of the Agg?
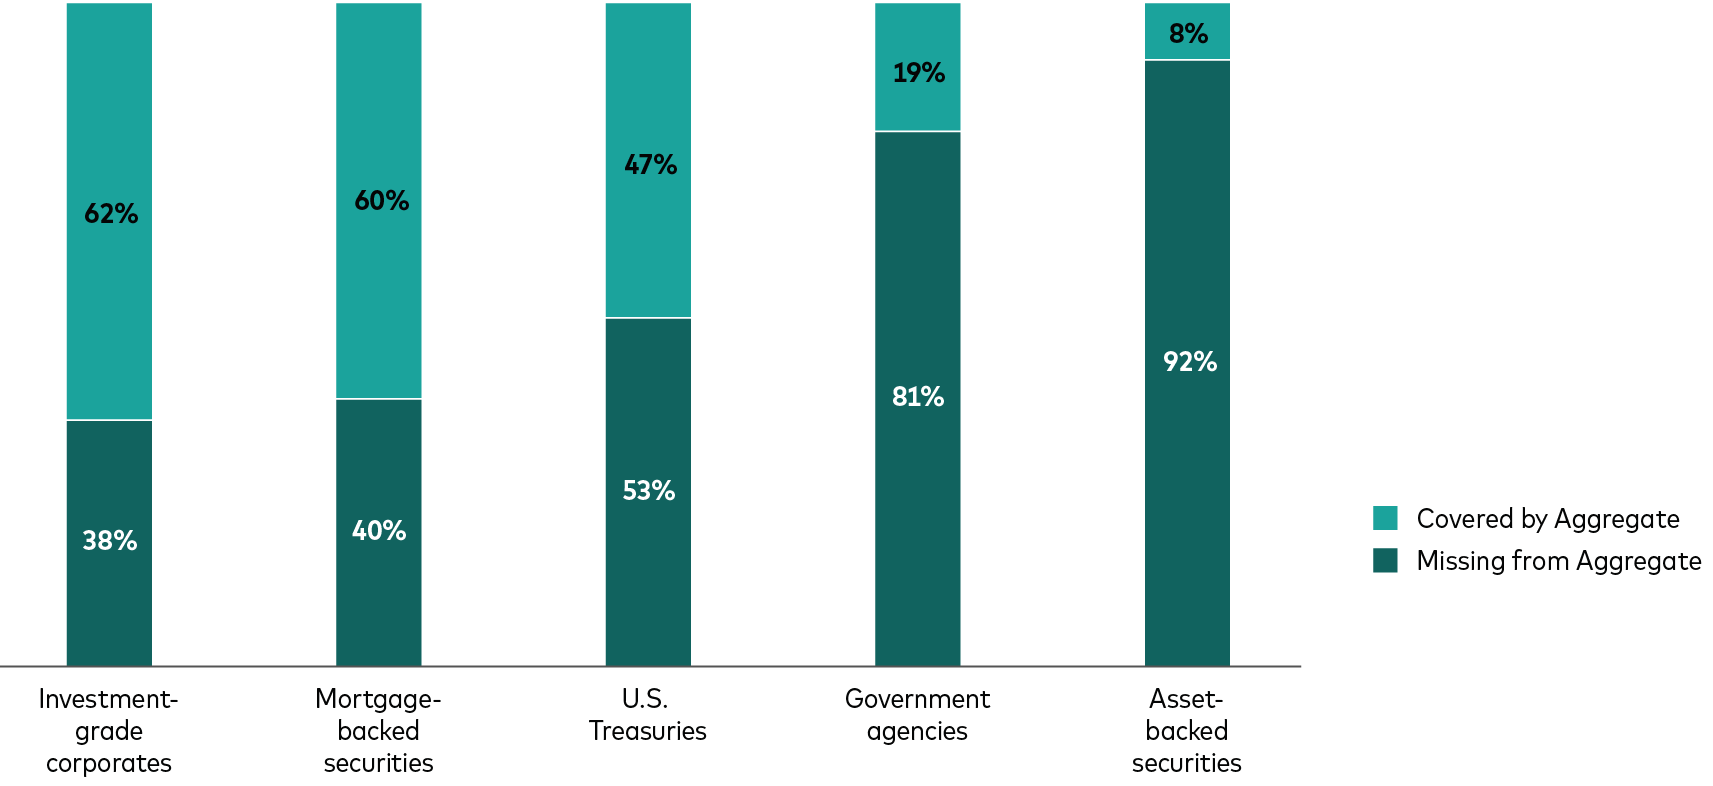
Source: Bloomberg, as of March 31, 2025.
Contrasting passive and active
More narrowly focused index-based ETFs can target areas such as mortgage-backed securities, inflation-protected securities, or corporates. Additionally, international bond ETFs can access the investment-grade non-U.S. sovereign, corporate, and emerging markets.
However, investors who choose this approach must decide which ETFs are appropriate and how much to invest to achieve sufficient exposure to a global fixed income market, which totaled $140.7 trillion at the end of 2023. If investors are using ETFs that focus on select asset classes, they must consider the optimal time for rebalancing, as well as whether to overweight or underweight those positions.
Are you a head coach? A football analogy may explain how active ETFs can simplify this process. During a game, defensive coordinators decide how many linemen, linebackers, and defensive backs to use on each play, depending on the score, the down, distance to a first down or a score, and time remaining on the clock. They then typically call for alignments of the players and plays for them to run.
Professional fixed income managers perform a similar role. They must decide daily how to allocate the portfolio between U.S. Treasuries, investment-grade corporates, high-yield, emerging markets bonds, and other options based on factors like credit spreads, interest rates, and economic news. They select individual securities, or asset allocation positions, just as coaches pick specific players for a given play.
The key question to consider is: Are you the best possible fixed income coordinator for your own team? Or are you the head coach of your portfolio, and you find it’s best to hire professionals to act as the fixed income coordinator?
Vanguard active bond offerings
VPLS provides active exposure to U.S. government debt and investment-grade corporates and flexibility to invest larger portions in high-yield corporates, emerging markets, and foreign sovereign bonds, as well as asset-backed and commercial mortgage-backed securities.
This core-plus product has an annual alpha target of 75 basis points against its benchmark, the Bloomberg U.S. Universal Index (known as the “Universal”).
- VPLS has a 0.20% expense ratio.
Meanwhile, VCRB has a higher-quality bias, as it focuses primarily on investment-grade corporate bonds, Treasuries, and agency mortgage-backed securities. It has an annual alpha target of 60 basis points against its benchmark, the Bloomberg U.S. Aggregate Float Adjusted Index.
- VCRB has a 0.10% expense ratio.
A universe of additional opportunity: Vanguard considers the Bloomberg U.S. Universal Index a better benchmark than the Agg for a core-plus strategy because of its more comprehensive exposure to the U.S. bond market. In addition to holding the categories in the Agg, the Universal also includes U.S. high-yield corporates, greater exposure to structured products and (dollar-denominated) emerging markets, and other less mainstream bond sectors.
These sectors have more credit risk, but often less interest rate risk. They also tend to offer high yields and greater opportunity for selection and allocation decisions for active managers.
- Both VCRB and VPLS are designed to serve as the centerpiece, or even the only piece, of an investor’s fixed income allocation.
A tale of two benchmarks

Source: Bloomberg Fixed Income Index Methodology, published October 15, 2024.
The value of ownership
Vanguard is an investment company owned by the people who invest in our funds. That means our investors are our owners,1 and we can pass along economies of scale and take a different approach to active fixed income.
Our structure allows our active managers to avoid taking excessive risk to offset higher fees. We only assume risk when our investors are adequately compensated.
The result: better risk-adjusted returns. Nearly all—91%—of our active funds have delivered better risk-adjusted performance than their peer-group averages, according to Lipper data from LSEG Data & Analytics.2
Separate and distinct
VCRB and VPLS share the benchmarks, management teams, and expense ratios of the Admiral share classes of their respective mutual fund counterparts, both of which have longer track records than the ETFs.
The funds are separate and distinct products from the ETFs. Natural differences in total asset size, client cash-flow activity, and other factors will result in differences in fund holdings and, in turn, modest differences in fund performance between the corresponding ETFs and mutual funds, particularly over shorter time periods.
1 Vanguard is owned by its funds, which are owned by Vanguard’s fund shareholder clients.
2 For the 10-year period ending December 31, 2024, 42 of 46 Vanguard bond funds outperformed their peer group averages; results will vary for other time periods. Only funds with a minimum 10-year history were included in the comparison. (Source: LSEG Lipper.) Note that the competitive performance data shown represent past performance, which is not a guarantee of future results, and that all investments are subject to risks. For the most recent performance, visit our website at www.vanguard.com/performance.

Notes:
Vanguard Core Bond ETF and Vanguard Core-Plus Bond ETF are not to be confused with the similarly named Vanguard Core Bond Fund and Vanguard Core-Plus Bond Fund. These products are independent of one another. Differences in scale, certain investment processes, and underlying holdings between the ETFs and their mutual fund counterparts are expected to produce different investment returns by the products.
For more information about Vanguard funds or Vanguard ETFs®, visit vanguard.com to obtain a prospectus or, if available, a summary prospectus. Investment objectives, risks, charges, expenses, and other important information are contained in the prospectus; read and consider it carefully before investing.
Vanguard ETF Shares are not redeemable with the issuing Fund other than in very large aggregations worth millions of dollars. Instead, investors must buy and sell Vanguard ETF Shares in the secondary market and hold those shares in a brokerage account. In doing so, the investor may incur brokerage commissions and may pay more than net asset value when buying and receive less than net asset value when selling.
All investing is subject to risk including the possible loss of the money you invest. Diversification does not ensure a profit or protect against a loss. Past performance is no guarantee of future results.
Bond funds are subject to the risk that an issuer will fail to make payments on time, and that bond prices will decline because of rising interest rates or negative perceptions of an issuer’s ability to make payments.
Investments in bonds issued by non-U.S. companies are subject to risks including country/regional risk and currency risk. These risks are especially high in emerging markets.
High-yield bonds generally have medium- and lower-range credit-quality ratings and are therefore subject to a higher level of credit risk than bonds with higher credit-quality ratings.